
Well it has been one month since I left Tableau and started my first business, Data Literacy, LLC. What a fun month for me! I’ve really appreciated all of the positive encouragement and support I have received since making the announcement. I was surprised to see the news covered by GeekWire, and my kids definitely got a kick out of that. It was also refreshing that so many people who have been working on data literacy for some time now went out of their way to welcome me to the space – people like Jordan Morrow, Valerie Logan, Jane Crofts, Matthew Jesser, Dave Mathias and others. It’s a very supportive group, and I’m glad to be a part of it. Closing the data education gap that exists right now is an all-hands kind of thing.
I’ve been hard at work on my website and programs, the Data Literacy Advocates group I started with Anna Foard on LinkedIn has grown to over 1,100 people, and I’ll be setting up my downtown Bellevue office starting tomorrow, so things are coming along nicely. I was excited to be able to run a free program last month for veterans covering a set of data literacy training materials for the first time. It was great to get to know them a bit over four 3-hr courses in two weeks, and I was grateful for the opportunity to spin the wheels on some new content.
I’m also thrilled to announce today that an ebook I’ve been working on for some time is now available for download! The title of the ebook is “17 Key Traits of Data Literacy”, and anyone who subscribes on my site can get a free copy in their inbox. Yep, I’m making you sign up for it, dammit. At least it’s free, though, and don’t tell anybody else, but you can always just unsubscribe on the very first email you get with the ebook. Shhhh.
So what’s this ebook about, and why am I so happy to put it out there? Going back about a year or so, I started to ask myself what it meant to be highly “data literate”. I had heard that phrase popping up here or there, but I couldn’t find a thorough explanation of what it meant. So I decided to make a list of the traits that came to mind when I thought about all of the talented data professionals I’ve had a chance to work with over the years at Tableau, at Medtronic, and elsewhere. It’s not very long – it’s just 22 pages, and a bunch of those pages are basically graphics and art. So for once I wasn’t long-winded.
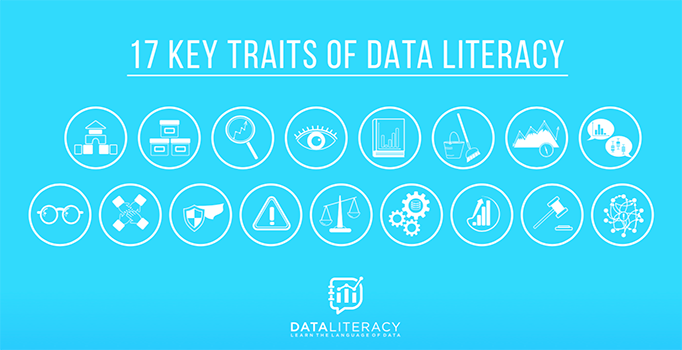
I divided the list into knowledge (things they know), skills (things they can do), attitudes (ways they think or feel) and behaviors (how they act). I wanted the list to go beyond just tools and techniques. It doesn’t mention a single tool, actually. Don’t get me wrong, tools are great. But they’re a means to an end, they’re constantly in flux, and they should be. Concepts like data ethics, inclusiveness, confidence and continuous improvement are included, though. I don’t see them as just nice warm-and-fuzzies to add to the list – they’re critical and without them any data-driven initiative will fall apart.
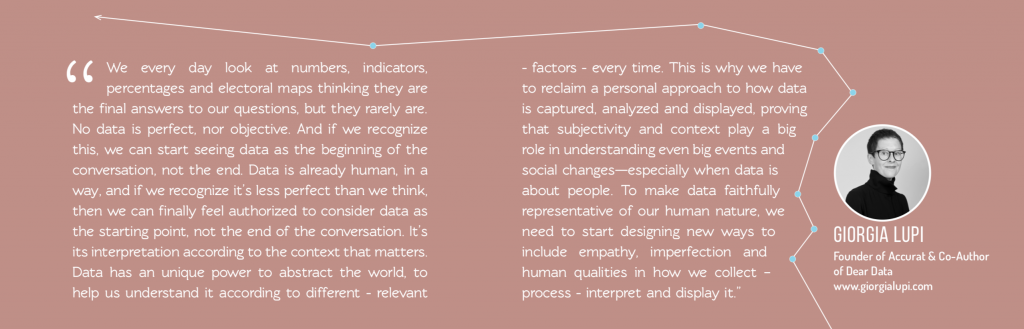
I then was able to get some incredibly helpful feedback from some people I greatly admire in the data space. People like Tamara Munzner, Andy Cotgreave, Anna Foard and others all gave it a once over and made some very helpful suggestions. It was delightful to me that four absolute data heroes – Alberto Cairo, Giorgia Lupi, RJ Andrews and Cheryl Phillips – all agreed to not only read it over, but to take time to provide exclusive quotes for the book – one for each of the four sections mentioned above. I’m extremely grateful for their contributions.
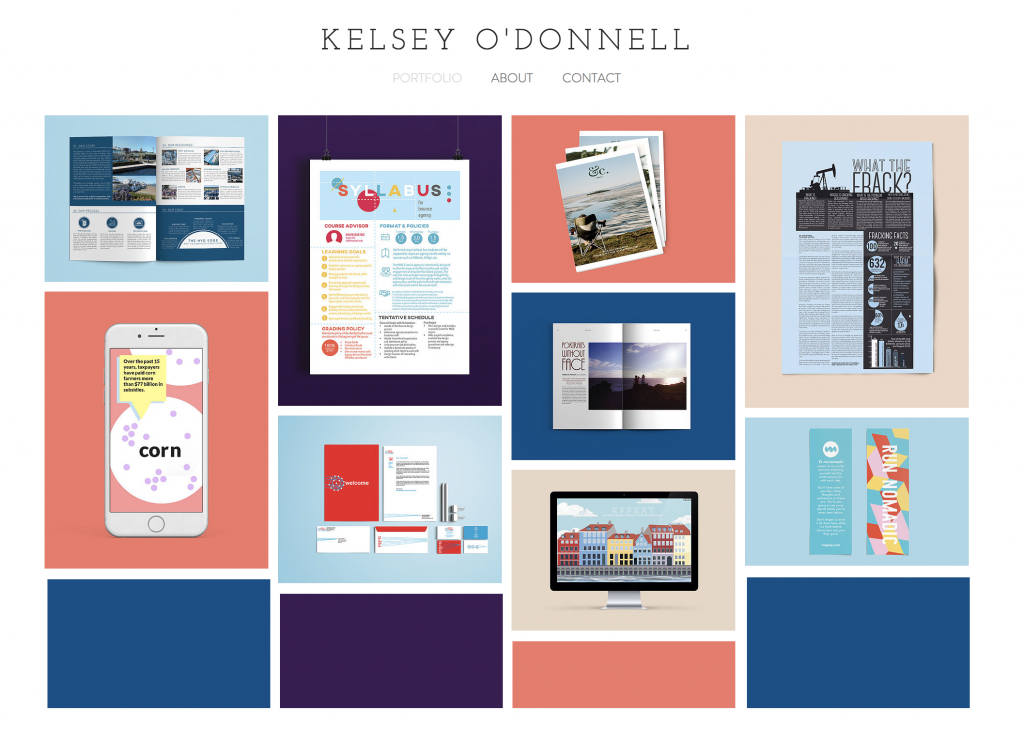
I’d also be remiss not to mention how much I appreciate the amazing design and layout work of Kelsey O’Donnell. The polish is literally all Kelsey – the icons, the layout, the fonts, the graphical treatment. I gave her the photos, the data art and the copy, but the rest was her. She even gave me editorial feedback and steered me away from a primary-color-only palette, not just for this piece, but for my entire business. I was beyond lucky to find her and secure her assistance. You can reach out to her if you want her help, too, but take it easy – I plan to work with her a LOT more going forward. I remember when I first saw her online portfolio – she had me at “What the Frack?“:
Notice that I don’t claim this to be “THE” 17 traits. I feel strongly that these elements all matter quite a lot, but I don’t believe they’re necessarily a comprehensive set. The data space itself is moving fast, and new methods are being created all the time. So you may know an 18th or 19th key trait, a 20th may emerge next year, and I’d be happy to hear your thoughts about all that.
There’s a checklist at the end of the ebook for people to go through and evaluate themselves, but it’s not really like these traits are binary, just as data literacy itself isn’t binary. There are definitely degrees and levels to each of these traits, and I love Michael Correll’s recent article about this on the new Multiple Views blog in which he points this out. The purpose isn’t to use the list to say “I’m data literate and that person is not.” The purpose is to think deeply about what it means to grow in data literacy, and to aspire to even higher levels of fluency, just as a poet, scientist or artist would push themselves to increasing levels of proficiency in a lifelong effort to hone their craft.
I invite you to subscribe and download the ebook, and I hope you find it helpful! I definitely benefitted from writing it. I’ll be hosting a webinar on this topic on January 16th from 12pm to 1pm PST, so feel free to register for that here. It’s only open to the first 100 people who register, but don’t worry, I’ll put the whole thing on the Data Literacy YouTube channel when it’s over and done with.
Thanks again for all the support and encouragement. I wish you a Happy New Year, and I’m glad to be on this data literacy journey with each of you.
Best,
Ben

I am excited for the webinar!
The community you are building is important. I know at times data professionals feel teeny, hurling pebbles at the giants of the big data industrial complex.
Thanks for your giant leap 😉
Haha, yes, no kidding! Talk about a massive mission to close the data literacy gap in the world. Thanks for your interest, Bonny! I hope the ebook and webinar are super helpful for you.
Hi Ben, just wondering if a recording of the webinar is available. I was not able to dial in for the live session.
Thank you.
Yes! Sure is.. https://youtu.be/KA_e1uFSWUM
As a data enthusiast and professional, I’m always keen to learn.