
I had a chance to attend and present at Plotly’s PlotCon in New York City earlier this week along with Matt Sundquist, co-founder of Plotly. Matt is a truly brilliant person (just check out the work on his Plotly profile), and a great all-around guy, so it was a pleasure to work with him on the presentation.
Matt and I had met at previous data events over the past year and we started a conversation about how we could get Tableau and Plotly to work together. Why would we want to do that? Two reasons. First, like all tools, Tableau and Plotly each have their own strengths. Every now and then a project comes along that can benefit from the best of both worlds. Second, it behooves us all as data workers to find solutions that allow collaboration across tools. This is why Tableau includes a powerful R integration, and it’s also why Plotly makes the Plotly Python Library available, among other things.
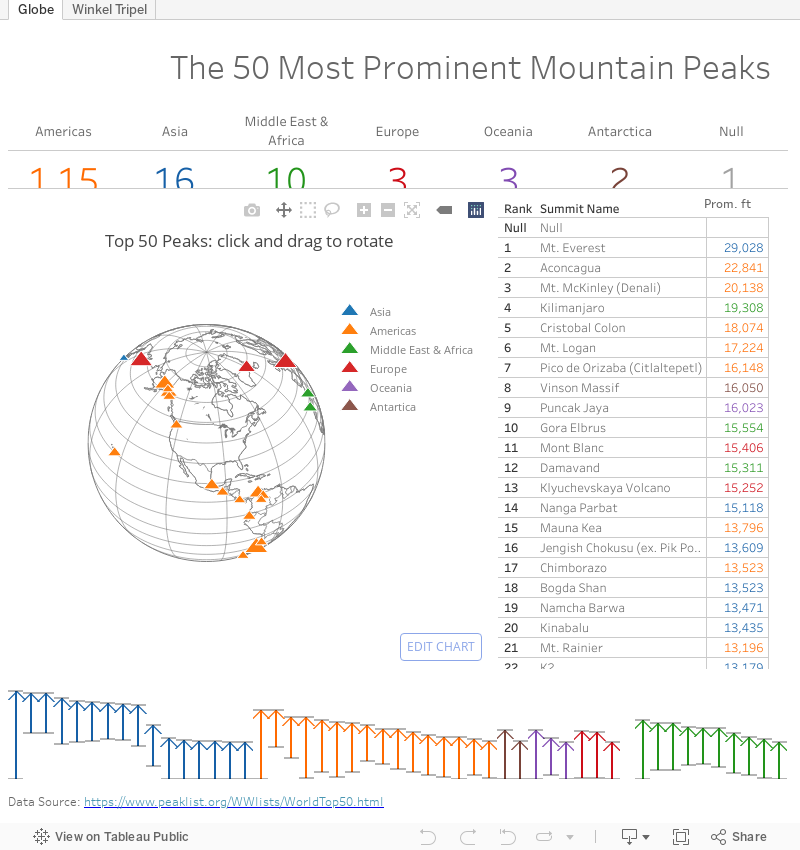
So I came up with an idea for a fun little personal project that allowed me to combine Tableau’s richly interactive dashboards with Plotly’s built-in 3D viz and wide variety of mapping projections. Here’s the finished version, built for desktop only:
So how did I make this hybrid viz?
It’s pretty simple, actually. I started with a somewhat outdated (and less than perfect) data set of the 50 most prominent mountain peaks in the world and I imported the table into Google Sheets using the IMPORTHTML function:
=IMPORTHTML(“http://www.peaklist.org/WWlists/WorldTop50.html”,”table”,0)
After converting the latitude & longitude for each peak from degrees, minutes seconds to decimal degrees in Google Sheets, I was ready to start vizzing.
I started by creating a variety of maps in Plotly, one for each region in the 3D globe map style, and another in the Winkel Tripel map projection. Here’s the globe version showing all of the 50 peaks:
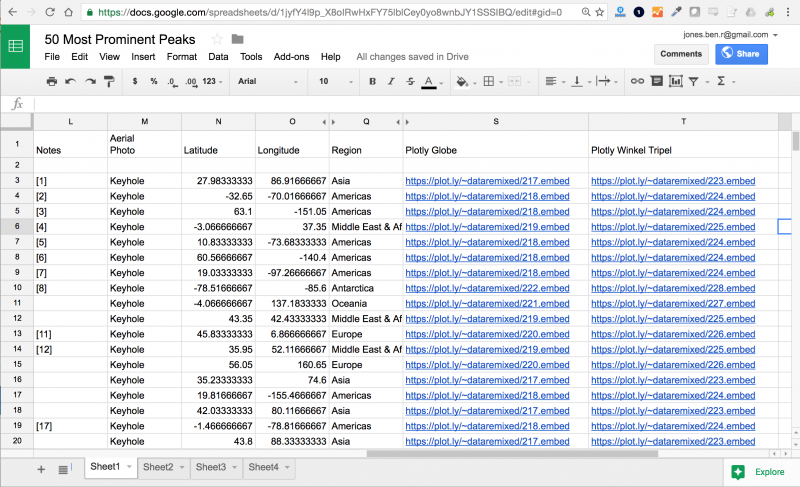
Each Plotly viz has an embed URL that you can obtain using the Share function – the one above is https://plot.ly/~dataremixed/204.embed. Notice the .embed at the end of the URL. This is key as it provides a webpage with nothing but the viz itself – perfect for adding to a Tableau dashboard. I added the Plotly embed URLs to my Google Sheets file into two columns – “Plotly Globe” and “Plotly Winkel Tripel” – one URL for each row corresponding to the peak’s region:
Next, I connected directly to the data with Tableau using the new Google Sheets connector. Then I built the various sheets in Tableau that I wanted to build around the Plotly map to provide the richly interactive experience that Tableau is so great at delivering. Note that I was sure to drag the fields “Plotly Globe” and “Plotly Winkel Tripel” to Detail in each of the Sheets – that way the Plotly embed URLs I created for my maps would be accessible in the dashboard.
Once I created the sheets, I added them all to a dashboard in Tableau and then dragged out a web page object onto the canvas. I added the URL indicated above and then created a new Dashboard Action, completing the dialog box like this:
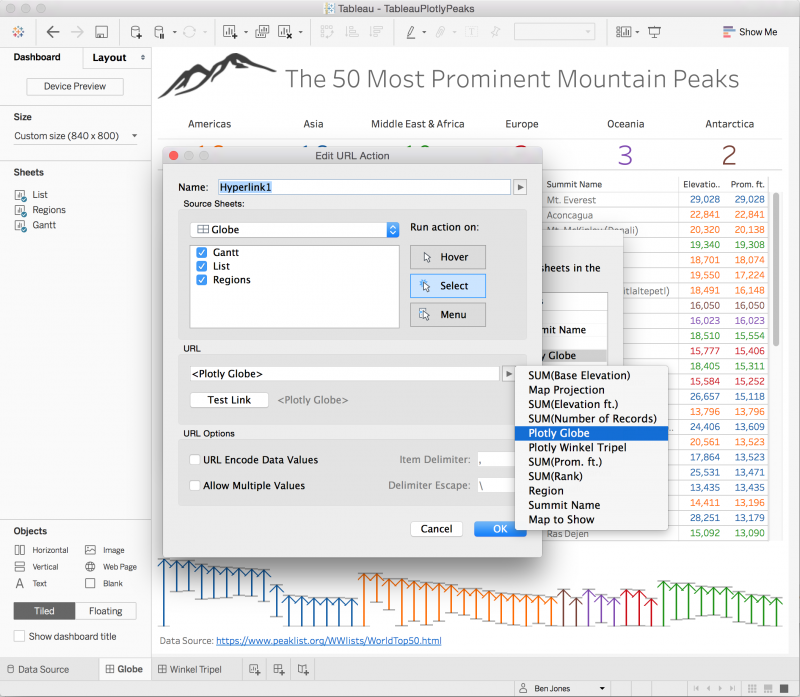
With this URL action created, every time I click on one of the Tableau sheets, it reloads the corresponding URL into the web page object on the dashboard, giving the reader a seamless experience with the Plotly vizzes. One thing that would be great to figure out how to add is a way to highlight a mark or marks on a Plotly viz based on a hover or select of a mark on a Tableau Sheet. There isn’t really a way to do that yet, as far as I know. So some room for improvement.
Matt and I are just staring to brainstorm different ideas. We hope this one is helpful for you. If you find more cool ways to make these powerful tools work together, be sure to let us know!
Thanks,
Ben
