
{Full disclosure: with 3 speeding tickets in the past 2 years and a huge car insurance bill, I approached this project with significant interest in arriving at one specific answer. I was surprised by what I found…}

Photo credit: gdoolittle
With the ongoing California state budget crisis, there has been a lot of talk about whether speeding tickets are the new “tax” on the residents of the Golden State. It is difficult to get too far down any of “the” California freeways without finding yourself in the cross-hairs of a CHP radar gun. Local news outlets, using less than a full set of data (as usual), have had a field day.
Could it be that a shortage in the coffers in Sacramento could translate into an increasingly large wave of checks from poor, busted drivers like myself? To find out, I went in search of annual citation figures for the first decade of the 21st century.
Believe me when I say that the data were not easy to obtain. Any time telephone calls, transfers to different departments and offices, and scanned pdfs of grainy printouts are involved, you know the data was not meant to be broadly distributed.
And one would have to consider more than just absolute counts of citations, since the number of drivers on the road changes every year. (see Table 1E here)
So what are the results? Take a look at the following Tableau Public control chart dashboard, which allows you to look at not just annual speeding tickets by count and by rate (per driver), but also stats for other citations such as drunk driving as well as highway safety stats such as injuries and deaths:
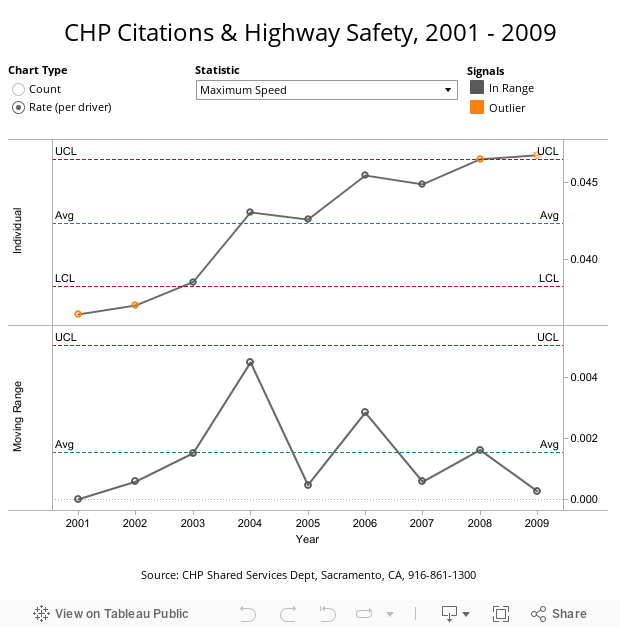
My take on the data:
1. Total speeding citation rates used to be lower than they are now, but not by all that much. Of all speeding tickets issued, the mix of “Maximum Speed” is going up and the mix of “Excessive Speed” is going down. The “universe” that created CHP speeding citations in 2001 and 2002 did so at a lower rate than it does today, but the slight increase in speeding citation rates happened (2003) well before the state budget crisis began. It seems the state budget crisis does not coincide with some huge surge in speeding tickets.
2. Technical citations such as registration violations and “fix-it” tickets are definitely on the rise, as is the enigmatic “Other Driving Violations” category. Cause-and-effect is difficult to entangle: are drivers feeling the economic pinch and thus fixing their vehicles less often, or are CHP officers on the prowl for such typical abuses (come to think of it, I’m pretty sure my front left signal light just died…). The data don’t provide these answers.
3. Seat Belt citation rates are dropping (if you add 2010 figures, the most recent data point is below the LCL), and Drunk Driving citations rates are pretty flat, showing no outliers.
4. Total citation rates are not any higher from a statistical perspective. There are more drivers, but every year the ratio of citations to drivers is anywhere from 1:9 to 1:11. Yes, different types of tickets are being issued – some types are on the rise and others are on the decline – but overall the situation is much the same as it was when money wasn’t so tight.
This was hardly the picture of systematic pillaging I was hoping expecting to find. One can credit the CHP with being smarter than sending out uniformed officers en masse to harass unsuspecting citizens. Raising ticket rates is a much smarter way to add to top line without adding to the bottom line, and that’s just what has happened. I am sure if a control chart of revenue from citations were created, it would show a statistically significant trend. My contact at CHP did not have this data to provide me.
The full picture cannot be appreciated without considering the real victims on the highways – not the lead-footed drivers like me getting slapped with larger fines than before, but the people who die every year. The good news for Californians is that these numbers are trending down – select “Victims Injured”, “Victims Killed” and “Alcohol Involved Fatalities” in the dashboard and you will see that the most important statistics that matter are headed in the right direction – downward.
Yes, this is likely due in part to improvements in automobile safety & technology, and a gradual retiring of older vehicles without airbags, but to all the CHP officers who have made a sucker out of me – I am glad you have fewer and fewer tragic “first responses”, and hope this trend continues.
Be safe,
Ben @DataRemixed
PS: Here’s the data set 2904_001

Pingback: How-to Make Control Charts with Tableau | DataRemixed