
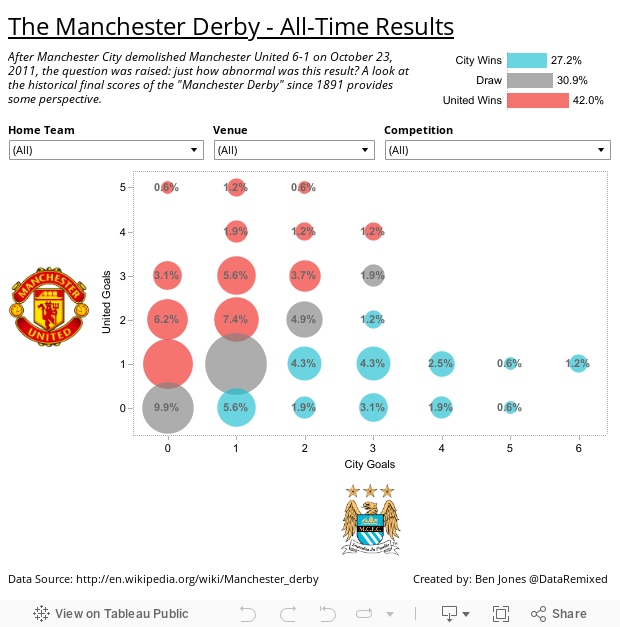
Andy Kriebel at vizwiz.blogspot.com blogged recently about a remarkable result of a soccer (er, football) match known as The Manchester Derby – played between Manchester United and Manchester City. In 161 matches dating back to 1891, this rivalry has produced games in which the two Manchester teams combined to score 7 goals just 5 times, including this past October, when City defeated United by the unlikely score of 6-1 at Old Trafford.
In Andy’s post, he transforms a pretty basic spreadsheet (of the kind we use very often in business) and converts it into a table that features a heat map which highlights common match scores using color intensity (red).
I played around with this data set and came up with the following bubble chart which uses area to highlight common scores:
Try playing around with the drop down filters and find out who has fared better at home as compared to on the road, by venue and by type of match played.
As always, thanks for visiting,
Ben

This is awesome Ben! I like the idea of using a bubble chart and the interactivity is super straight forward. Really, really good!
Andy – much thanks for inspiring this viz & post.
Pingback: Visualization is King