
Last night I was analyzing earthquake data from the USGS Earthquake Hazards Program. When I woke up this morning, I was assaulted with tweets about the 5.1 magnitude earthquake in La Habra. I spent most of my life in L.A. Coincidence? I think not. Okay, yes, it was absolutely a coincidence.
{A tangential rant: Obviously I’m conflating correlation and causation, but as dumb as that line of reasoning is, it underlies a huge chunk of human thinking – superstition, astrology, plenty of religious thought, ENTIRE BRANCHES OF MEDICINE. In a word: pseudoscience. Not good, people.}
Back to earthquakes: I was updating a viz about the history of recorded earthquakes around the world since 1900. Here it is:
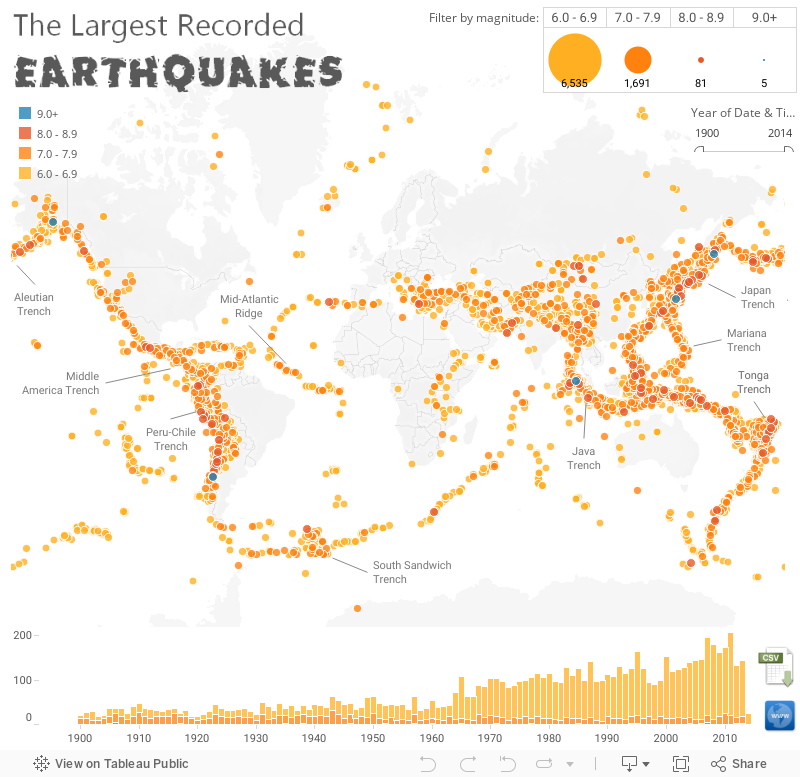
It clearly shows the clustering of earthquakes along trenches and fault lines, a fact that we take for granted now but was not known by humanity prior to the 1960s.
It also shows what seems to be a dramatic rise in earthquakes around the world. Of course what we are looking at here is recorded earthquakes, not actual earthquakes. A minor point? Not really. The number and type of seismographs changed throughout the course of the 20th century. Simply: they got better, and more were installed. So this data set can’t really answer the question: “Are actual earthquakes increasing?” It’s only really the number of recorded 6.0 – 6.9 magnitude earthquakes that increased. We got better at detecting and measuring earthquakes in this range and below. It’s not easy to miss a 8.0.
Los Angeles
All the talk today is about earthquakes and Los Angeles. Here are the 6.0+ earthquakes in the Los Angeles area since 1900:
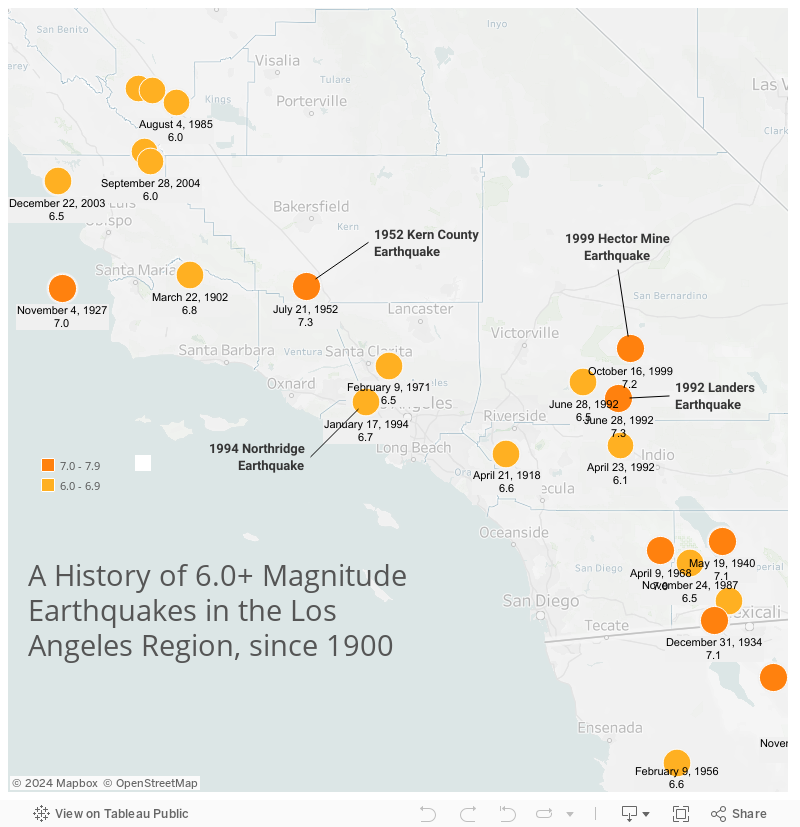
I remember the 1994 Northridge earthquake very well. It was pretty incredible. For all the talk of “data storytelling“, the little orange dot on the map doesn’t really tell the story of the Northridge earthquake, or any of the other ones for that matter. That’s good perspective for all of us.
I’m not saying data can’t give a human side of the story – I believe it can (I help run a conference about it). But if you want to know how people felt during an earthquake, you’d probably have to talk to them, and they’d each say something different. Data is great, but it doesn’t tell the whole story.
Shallow?
“Wait, the earthquake in Los Angeles was shallow…?” I mean, come on, what a total set-up, right? Even I had to love the tweets about the supposed relationship between the depth of the earthquake and the residents of L.A.
Serisouly, though, what about earthquakes, and frequency of magnitude and depth? These dot plots show how common larger earthquakes are, and how far below the surface of the earth they occur:
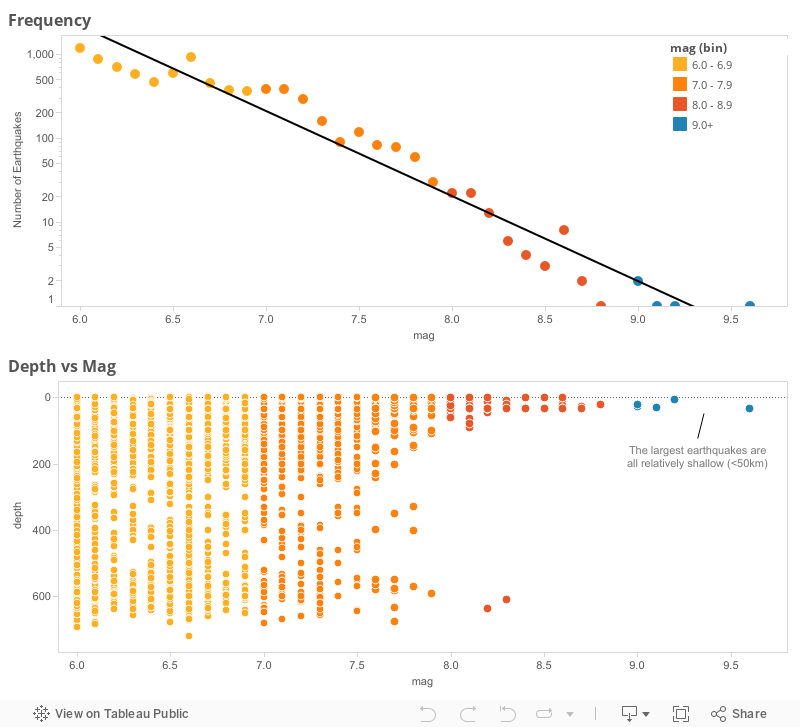
The moral of the story? I guess it’s not just in Los Angeles where you’ll find shallow ones that cause a relatively big stir…
Thanks for reading,
Ben

OMG, stop the puns!
But seriously, interesting little project. Though I am confused by your choice of color scale. Why suddenly change the hue for 9.0+? I realize that magnitude 9.0 and higher is very significant, but it’s still a continuous (if logarithmic) scale. I think you should either stick to a purely continuous scale, or break it up into classes and then use more clearly different colors.
And as for stories: the few numbers you get from the USGS clearly can’t tell you much of a story about each of these quakes. But I’m sure there’s plenty of data to be had about damage, injuries, casualties, etc. to turn this into more.
Robert! Thanks for commenting. Sorry if you were less than eager to see all those puns… 🙂
As for color choice, good question. The goal was to make the five 9+ earthquakes since 1900 immediately noticeable, and a darker red just didn’t do it. The switch to blue takes is cue from blue stars and the part of a flame, both of which are hotter than their red counterparts. Hope that adds some context to that decision. I’ve never experienced a 9.0, but my guess is that it would be something altogether different that what I have lived through – something that not even injury stats could convey.
Hi Ben
Nice viz and story. I had the same observations as Robert did so thanks for the explanation.
I do like the annotations, they add a lot.
Lots more that can be done on this subject.
Cheers
@paulbanoub
http://www.vizninja.com