
Q: In data visualization, is there a single “best” way to visualize data in a particular scenario and for a particular audience, or are there multiple “good enough” ways?
That’s the debate that has resurfaced on Stephen Few’s and Cole Nussbaumer’s blogs today.
- In summary, Few says “Is there a best solution in a given situation? You bet there is.”
- In contrast, Cole says “For me, though, it is possible to have multiple varying visuals that may be equally effective”
Could Both be Right?
This is going to sound strange, but I think both are right, and there is room for both approaches in the field of data visualization. Let me explain.
Lucky for us, really smart people have been studying how to choose between a variety of alternatives for over a century now. Decision-making of this sort is the realm of Operations Research (also called “operational research”, “management science” and “decision science”). Another way of asking the lead-in question is:
Q: When choosing how to show data to a particular audience, should I keep looking until I find a single optimum solution, or should I stop as soon as I find one of many that achieves some minimum level of acceptability (also called the “acceptability threshold” or “aspiration level”)?
The former approach is called optimization, and the latter was given the name “satisficing” (a combination of the words satisfy and suffice) by Nobel laureate Herbert A. Simon in 1956.
So which approach should we take? Should we Optimize or Satisfice when visualizing data?
I believe there is room for both approaches. Which approach we take depends on three factors:
- Whether or not the decision problem is tractable
- Whether or not all of the information is available
- Whether or not we have time and resources to get the necessary information
But What is the “Payoff Function” for Data Visualizations?
This is a critical question, and where I think some of the debate stems. Part of the challenge in ranking alternative solutions to a data visualization problem is determining what variables go into the payoff function, and their relative weight or importance. The payoff function is how we compare alternatives. Which choice is better? Why is it better? How much better?
Few says that “we can judge the merits of a data visualization by its ability to make the information as easy to understand as possible.” By stating this, he seems to me to be proposing a particular payoff function: increased comprehensibility = increased payoff.
But is comprehensibility the only variable that matters (did our audience accurately and precisely understand the relative proportions?) or should other variables be factored in as well, such as attention (did our audience take notice?), impact (did they care?), aesthetics (did they find the visuals appealing?), memorability (did they remember the medium and/or the message some time into the future?) and behavior (did they take some desired action as a result?).
Here’s a visual that shows how I tend to think about measuring payoff, or success, of a particular solution with hypothetical scores (and yes, I’ve been accused of over-thinking things many times before):
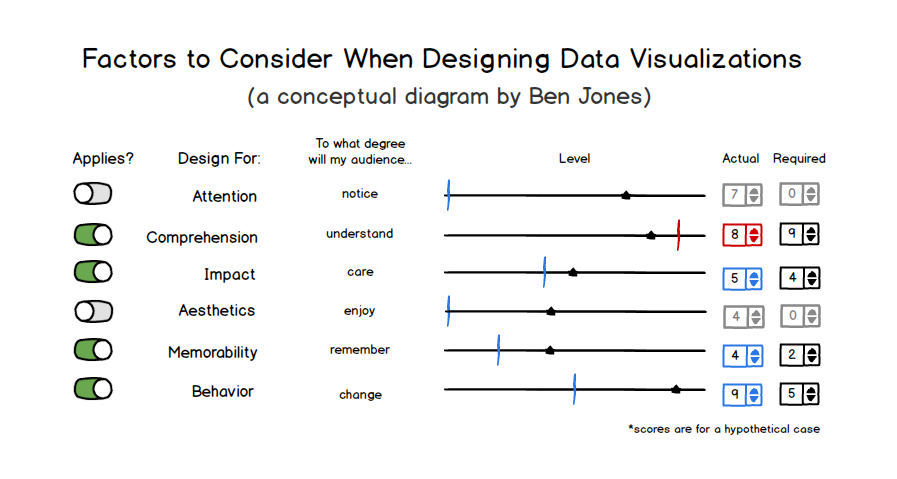
It’s pretty easy to conceive of situations, and I’d venture to say that most of us experienced this first-hand, where a particular visualization type may have afforded increased precision of comparison, but that extra precision wasn’t necessary for the task at hand, and the visualization was inferior in some other respect that doomed our efforts to failure. Comprehensibility may be the single most important factor in data visualization, but I don’t agree that it’s the only factor we could potentially be concerned with. Not every data visualization scenario requires ultimate precision, just as engineers don’t specify the same tight tolerances for a $15 scooter as they do for a $450M space shuttle. Also, visualization types can make one type of comparison easier (say, part-to-whole) but another comparison more difficult (say, part-to-part).
Trade-Offs Abound
What seems clear, then, is that if we want to optimize for all of these variables (and likely others) for our particular scenario and audience, then we’ll need to do a lot of work, and it will take a lot of time. If the audience is narrowly defined (say, the board of directors of a specific non profit organization), then we simply can’t test all of the variables (such as behavior – what will they do?) ahead of time. We have to forge ahead with imperfect information, and use something called bounded rationality – the idea that decision-making involves inherent limitations in our knowledge, and we’ll have to pick something that is ‘good enough’.
And if we get the data at 9:30am and the meeting is at 4pm on the same day? Running a battery of tests often isn’t practical.
But what if we feel that optimization is critical in a particular case? We can start by simplifying things for ourselves, focusing on just one or two input variables, making some key assumptions about who our audience will be, what their state of mind will be when we present to them, and how their reactions will be similar to or different from the reactions of a test audience. We reduce the degrees of freedom and optimize a much simpler equation. I’m all for knowing which chart types are more comprehensible than others. In a pinch, this is really good information to have at our disposal.
There’s Room for Both Approaches
Simon noted in his Nobel laureate speech that “decision makers can satisfice either by finding optimum solutions for a simplified world, or by finding satisfactory solutions for a more realistic world. Neither approach, in general, dominates the other, and both have continued to co-exist in the world of management science.”
I believe both should co-exist in the world of data visualization, too. We’ll all be better off if people continue to test and find optimum visualizations for simplified and controlled scenarios in the lab, and we’ll be better off if people continue to forge ahead and create ‘good enough’ visualizations in the real world, taking into account a broader set of criteria and embracing the unknowns and messy uncertainties of communicating with other thinking and feeling human minds.
Thanks for reading my $0.02. I’d like to hear your thoughts.
Ben

Awesome post, Ben! I think the parallels you draw make a lot of sense. The part about payoff functions and there existing numerous different coexisting goals (attention, impact, aesthetics, memorability, and behavior, in addition to comprehension) really resonated with me.
I must say that I don’t like the word “satisficing,” probably because it (intentionally) connotes non-optimization. On the one hand, it seems like optimization should always be the goal, but as you point out, this isn’t always necessary or possible.
Great food for thought. Thanks for contributing to the debate!
Sure, my pleasure, and thanks for valuing my input to the debate. I hear you – ‘I’m a great satisficer’ said no one ever, but I think the practice can be far more worthy that its name suggests. The way I understand it, it’s just the word for what you mean when you say “multiple visuals…equally effective”.
Really great post!
The statement I use when running training is ‘the most important part of communicating data is the communication, not the data’. My point is that all the key aspects about great communication – understanding the audience – their needs and background, being clear about your message, identifying the right channel etc all apply as much to data viz as they do to words. There is never a single solution, it’s about making trade offs.
Ultimately we need to understand if our visualizations work for their intended audiences. We user usability testing to do this. I note in my comment on Stephen’s post that when we did this for divergent stacked bars they performed badly. I was a promoter but on this evidence I’ve stopped using them.
Anyone who has done user testing knows a truth: being well grounded designs are in the existing best practice doesn’t guarantee they’ll work with your audience.
Thanks Andrew. That’s an interesting point – that sometimes ‘best practice’ designs may actually test poorly with your audience. Based on my understanding of optimization, I wonder if that’s because the way we define ‘best practices’ may only include a subset of all of the things that actually matter in a given scenario. That’s just a hypothesis, mind you. It could be due to the fact that testing can be inherently messy, and you may not always be able to repeat your results.
Excellent post, Ben. I think you expressed it perfectly.
Thank you sir! I was worried that I may have over complicated things a bit. Glad it made sense to you.
Great post! One additional observation: I think the cost function for each of the dimensions is non-linear, in a sense that taking care of the basics in each area goes a long way with little effort, but the last 20% are really tough to get right in each dimension (corollary being that your total score can be much higher if you try and spread efforts across dimensions).
Hey Moritz! Thanks for commenting. I totally agree with your point about non-linearity. The law of diminishing returns can apply, and in particular I feel that comprehensibility can sometimes hit a ‘plateau’ for the particular task at hand. Increasing it beyond a point at which people “get it well enough” to do X doesn’t add to the payoff because they don’t need any additional amount of precision. Figuring out where the discontinuities are in the payoff curve for each variable is really, really hard though, so I can totally see why some would rather just assume it’s linear. They just need to understand that what they’re doing is “optimizing for a simpler world”.
A great post, Ben. Well summed up.
I also agree with Cole here – there must be a better word than “satisficing”, as it’s too near to sacrificing, therefore leading to thoughts of make-do or non-optimisation.
Hah, that’s two votes against the word ‘satisfice’ as a thing that anyone would be excited to do. Somehow ‘settling for less than the best’ also doesn’t do the trick, does it? Surely there’s a branding genius out there who can come up with something better for us… Actually, a sign I saw while touring Facebook sort of sums it up: “Done is better than perfect”. There’s something noble about figuring out what is the most efficient use of our time & resources – the approach that gives us the biggest bang for the buck. Thanks for commenting Nigel!
Great post, Ben. I replied over on Cole’s blog, but I thought I’d reply here with a link to a couple blog posts by a photographer I follow (since you and I both share a love of that hobby):
http://davidduchemin.com/2015/06/poetry-imperfection/
http://davidduchemin.com/2015/06/the-place-of-craft/
I know that data visualization and photography aren’t identical pursuits, but I see more similarity than not. And this debate, of whether there is “best” or “perfect” visualization echoes a lot of conversations in the photography world. What I like about David’s articles (and books) is that he pays tribute to the craft of photography but stresses that ultimately an emotional connection is what is paramount, and that emotional connection can result from an imperfect image. Does science/craft play more heavily in data visualization vs. photography? Maybe. That seems to be Steven’s position. Or is there a healthy dose of art that goes into it as well, resulting in multiple effective options?
-Mike
Bravo – what is true of photography is also true of data visualization: We can’t let our obsession with tools and ‘best practice’ techniques rob our craft of life and imagination.
Yes was wondering what others will come up with as alternatives to satisfice. Looking forward to the alternatives
Super post. Personally, I think “Good Enough” is the new “Great”. It’s an important mindset to have in today’s day age. It represents the best of the agile movement. It allows people of all skill-sets to ship something meaningful when time and resources are limited. People need to actively embrace it.
And might I add – I love the idea of the ““acceptability threshold”. People need to have a good sense for what that is before they jump into the creation process. This threshold varies from situation to situation.
Perfectly said. No absolutes in visualization because you are basically dealing with audience (people). It’s both a science and an art. Thank you :).
Perhaps we could do an acronym like MENSI – Meets or Exceeds Necessary Standards for Interpretation?
Or if we are still looking for a portmanteau, we could do “suitequate.” Suitable+Adequate.