
The FBI recently released nationwide crime statistics for 2010 and crime is down for the fourth year in a row. (If you want to see a nice summary visualization of crime rates, the Wall Street Journal has one here.)
This Tableau Public viz shows how crime in different states changed from 2009 to 2010 along two axes – property crime and violent crime – in both crime rate and % change tabs:
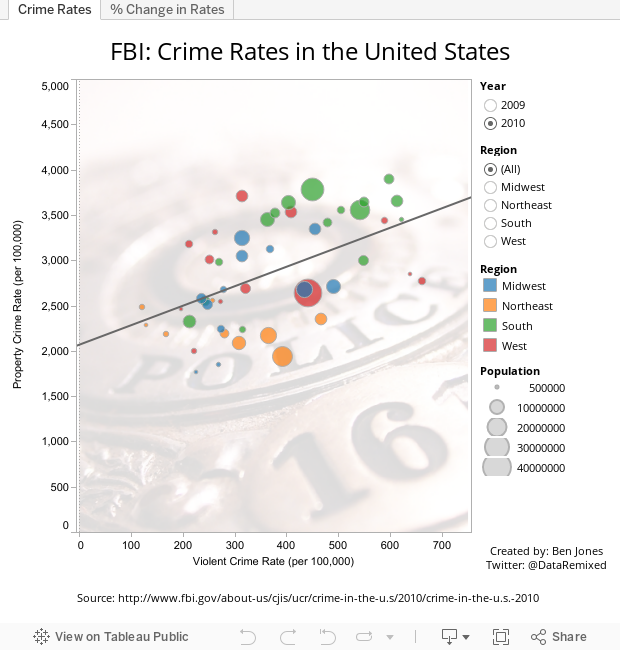
Photo used under Creative Commons from Scott Davidson
This is curious though – a slumping economy, high unemployment, and law enforcement agencies strapped for cash wouldn’t seem to be the ideal recipe for this soup. Much has already been said about what causes crime – just google “why is crime down” for a line up of groups ready to take credit or advance their theory (lead exposure?).
But I wonder whether the answer lies in comparing crime rate changes in different places. Take North Dakota, which posted double digit improvements in both property crime and violent crime in 2010. What changed in North Dakota that didn’t also change in, say, New Hampshire, which saw increases in both types of crime this past year?
Sorry, I don’t claim to know “the” answer, but this Tableau viz helps illustrate the complexity of this question. At it’s core, crime is a social animal with many faces. My guess is that takes more than one silver bullet to bring the animal down…
Thanks for stopping by,
Ben

Hi Ben, nice visualisation. How did you include the image in the background?
Thanks in advance
Hi James – thanks! To add a background image in Tableau, go to Data > Background Images > Add Image. The you have to size the image based on the x and y-axis min and max (so that it fits behind your data set properly). Tableau has a good training tutorial on how to do this starting at the 29 minute point here: http://www.tableausoftware.com/learn/tutorials/on-demand/advanced-training-mapping
Perfect – many thanks! BTW have just had a look at video showing whats new in Tableau 7 – the map improvements look great…