
(Update, 12/13/11: Download the Excel simulator file that was used to generate the frequencies here – 11MB)
This dashboard can be used to come up with a strategy to win at Monopoly (who wouldn’t want to do that?):
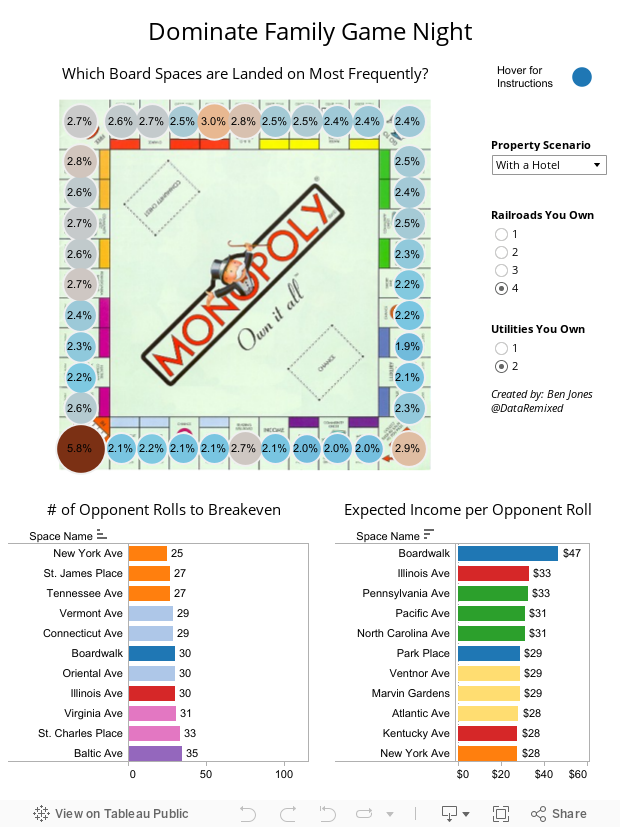
It answers the following questions:
1. What board spaces are landed on most frequently? (based on 60k simulated rolls)
2. How much can I expect to collect from my opponents per roll, on average? (based on frequency of visits times rent collected per visit)
3. How many rolls would it take on average for me to recuperate my investment in a property? (based on total investment in property divided by expected income per roll)
Explore different scenarios that will help you early in the game (“Single Property”) or at the end (“With a Hotel”) as well as other stages in between.
Bottom line: get a few railroads early, and make sure you own Boardwalk with a hotel for the knock-out punch. Putting lots of property on the orange set is also a winning strategy:
Have fun playing,
Ben @DataRemixed
Project notes:
1. The game was simulated using the RAND() function in Excel. Die rolls were generated using the formula =ROUNDDOWN(RAND()*6,0) +1
2. Chance & Community Chest card draws were simulated with VLOOKUP. Card draws were random (each with an equal probability of 1 in 17 chance), and each card was “replaced” between draws.

Ben, great job – really like the use of the custom image and filtering on it. Few questions:
1. Did you include the “Advance to” chance cards (e.g.: “Advance to Illinois Ave – if you pass Go, collect $200” and “Advance token to nearest Utility.”) Also, the throw 3(?) doubles and go to jail rule?
2. I would emphasize the bottom right chart more – this is the Return on Investment chart that I didn’t think you had until I looked closer. Even just swapping it to the left may help, or swapping the equation to get an income per roll (bigger is always better…)
3. I would get rid of the size and color legend – I don’t think they add anything, maybe even remove the size off the shelf altogether.
4. I would think about doing filtering on the image so that it filters the charts. However I wouldn’t want all the other bars to disappear, so maybe filter on a bigger category such as side of board or color block (all orange, all utility)
Again, really nice.
Hi Alex, thanks for the comments & suggestions, and for tweeting about this project!
Nice catch – I did have all the chance & community chest cards incorporated into the model, but NOT the three consecutive doubles -> jail rule, which I confirmed is an official rule (not a house rule). I updated the model & frequencies – predictably, the frequency of jail increases slightly.
I made a number of adjustments based on your suggestions, which are all great and much appreciated. All that is left to adjust as soon as I get the chance is the filter.
Thanks!
Ben
I love it! I ran a simulation like this about 15 years ago when I was first learning SAS, but only for the frequency of landing on each space. This is a much more informative presentation.
Here are some other fun statistical posts that use statistics or simulation to analyze games:
A statistical Jumble: http://blogs.sas.com/content/iml/2010/10/12/a-statistical-word-puzzle/
Visualizing Scrabble games:
http://blogs.sas.com/content/iml/2011/09/02/visualizing-scrabble-games/
How many times must you roll a die until you see all six faces?
http://blogs.sas.com/content/iml/2011/07/22/simulating-the-coupon-collectors-problem/
What are the chances that two people in a room have the same initials?
http://blogs.sas.com/content/iml/2011/01/19/hey-those-two-people-have-the-same-initials/
Hi Rick – thanks for the comments and the links! That’s funny, I did the same exact same Scrabble score tracker against my wife. I guess data nerds think alike… (also, espn has a similar score tracker for college games – click on any of the completed games at http://scores.espn.go.com/ncb/scoreboard and you can see the “dueling” line plots race to the finish at the top right.)
The game I prefer to share (for good reason): http://www.flickr.com/photos/67054973@N04/6334366687/
Incredibly creative and informative!
Thanks a lot Andy! Great to see you stopping by, I am a huge fan of your blog and the way you provide solid suggestions for improvement.
Cool – I found someone else who tackled this same puzzle: http://www.bewersdorff-online.de/amonopoly/ There is an animated image that shows the frequency change with each roll.
Fascinating work!
Are you sure this is correct? I’m looking at the expected income per roll with 2 houses. St. James Place and Tenessee both pay $200, exactly the same as a railroad, and they have slightly lower frequencies than 3 of the railroads. However, according to this, their income per roll with 2 houses is DOUBLE that of the railroads. What’s up with that?
Hi Charlie – thanks, you caught an error! I was using the income of $25, $50, $75, and $100 for 1, 2, 3, or 4 railroads, respectively, when I should have been using $25, $50, $100, $200. So basically owning 4 railroads was only showing as half the income generator it actually is. I made the correction, so it should be showing correctly now.
Thanks again, I appreciate the detective work! Let me know if you see anything else that doesn’t add up.
Ben
Hey, no problem, thanks for correcting it. I like your site a lot. I just thought it was weird that the railroads were so low, when in my experience having all 4 railroads is very powerful.
Hi Charlie – your intuition was correct about the railroads! Thanks for the kind words about my site, and for leaving your helpful comments.
Good work.
I added a few collums (24) on my copy of your economics.
ROI return on investments in % for each location and building and
also this ROI ajusted to the frequencies you so nicely generated in % also.
Not all properties pay out the same for the same cost of a house or hotel invested.
With all your work it was easy.
If you would like a copy let me know. Thank you.
Hi Dan – wow, this sounds awesome, can you please forward your work to my email address?
done
big file.
Please give me some feed back!
Dan
This is great. Haven’t played Monopoly in ages (German games have taken over our games nights somewhat) but will try some statistical strategies