
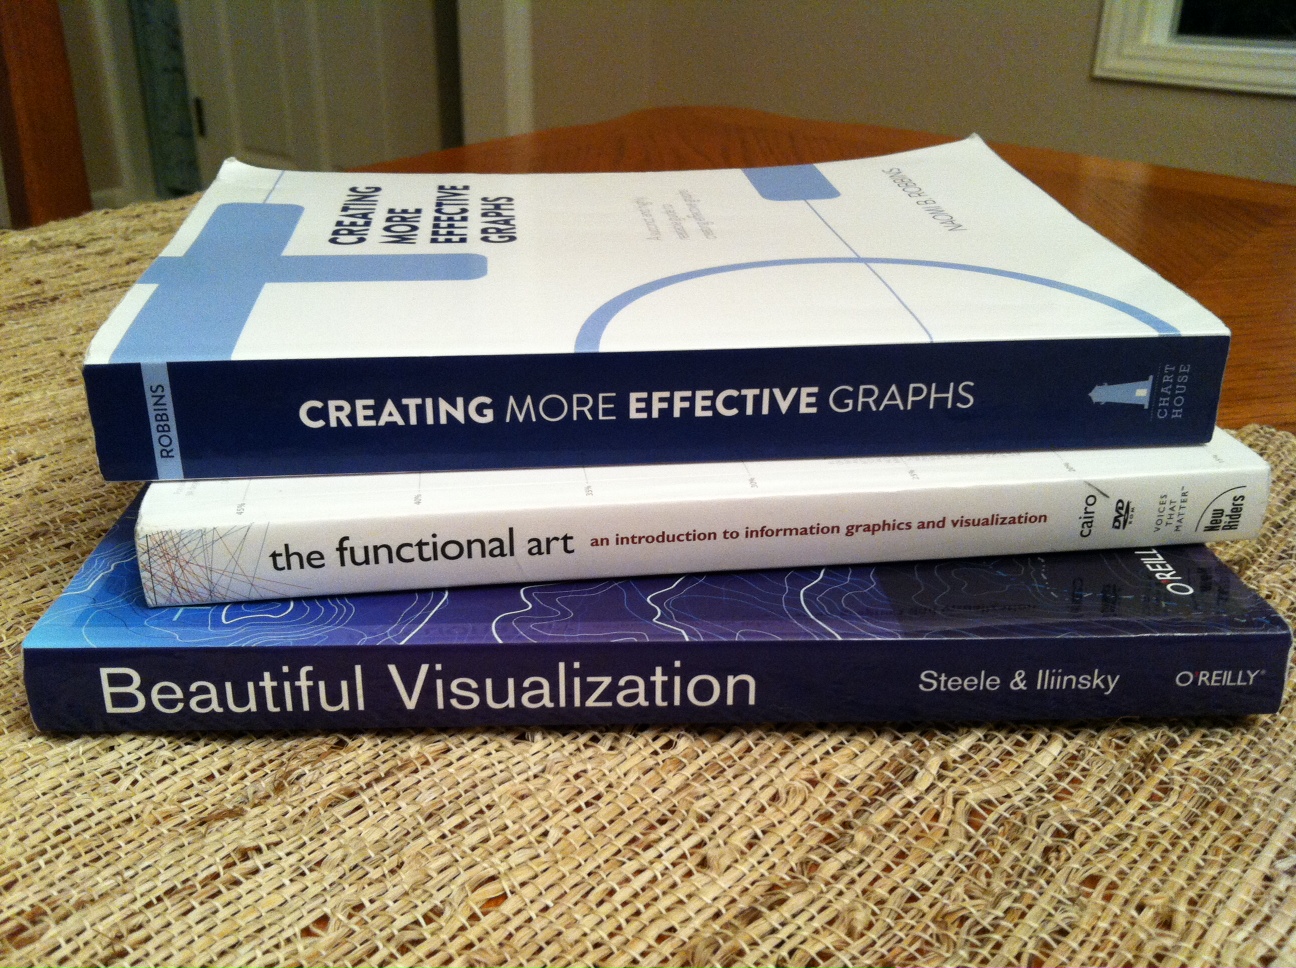
Data visualization touches many disciplines. Engineers, business practitioners, journalists, researchers and academics are all using graphical representations of numerical information to discover and communicate. There are many tools and resources available, and I’ve found the following three books helpful to give a sense of the overall picture of “data viz” right now.
Why are these three books particularly complementary? They give three different views of this emerging discipline – the view of the analyst, the view of the journalist and the view of the technologist, as follows:
- The analyst seeks to convey information accurately and clearly. The 1st book shows how to visualize data “right” (and how to avoid doing it wrong).
- The journalist is interested primarily in attracting and engaging readers. The 2nd book is a journalist’s bible for doing just that with data.
- The technologist is interested in pushing the boundaries and innovating. The 3rd book gives a glimpse into the lives of 24 such geniuses.
To be fair, this is an oversimplification, and all three books touch on all three aspects to some degree. But each book has it’s primary focus and perspective. I highly recommend all three. It would be best to read them in order. Here they are:
1. Creating More Effective Graphs – Naomi Robbins (2013)
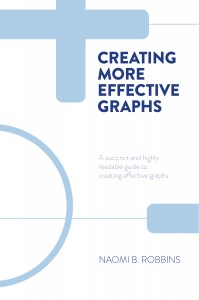
What it’s about: This book is about how to make charts and graphs that avoid common pitfalls and effectively communicate quantitative information in visual form. The emphasis is on clarity and accuracy.
Who it’s for: This book would be a great resource for students, analysts and journalists who are new to communicating data in visual form. More experienced visualizers will also benefit from a review of best practices.
What I liked about it: Naomi doesn’t just tell you what’s better, she shows you. She shows you a poorly designed chart (all bad examples have a stop sign labeled “NOT Recommended”) and then she asks you a question or two about the chart, such as “What do you see when you look at Figure 6.2?” In this way, she engages the reader to think. Naomi does a great job advocating for her favorite chart types: trellis plots and dot plots.
What could have been better: Naomi does such a great job with black and white, but color would be even better. Also, the examples are all individual charts; I’d love to hear her thoughts on multi-view interactive dashboards.
2. The Functional Art – Alberto Cairo (2012)
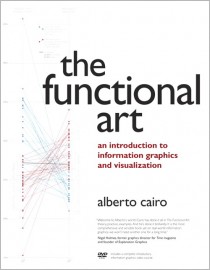
What it’s about: “An introduction to information graphics and visualization”, this book covers a wide range of topics, from visualization principles to journalism to the biology of the human visual system. It’s divided into four parts: foundations (from data to encoding to understanding), cognition (how the eye and brain process images), practice (creating static and interactive pieces), and profiles (interviews with experts who practice or study visualization).
Who it’s for: While this book will be illuminating for anyone, it’s primarily useful for journalists in my opinion. I believe analysts and practitioners could benefit by learning how to present information in an interesting and engaging way.
What I liked about it: I thoroughly enjoyed Alberto’s accounts of the creation of various examples of stunning data journalism, complete with richly detailed color images. This is his background, and it’s where he really shines.
What could have been better: Not much, though I didn’t feel the sections on anatomy added much value for me.
3. Beautiful Visualization – Edited by Steele and Iliinsky (2010)
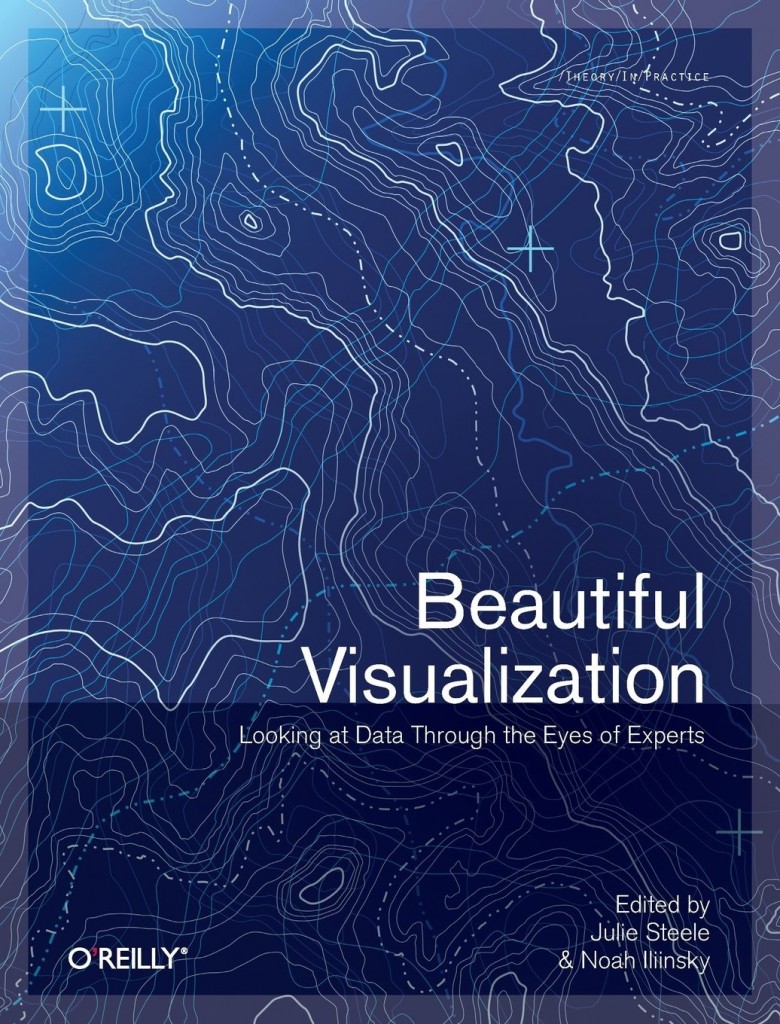
What it’s about: This book gives you a sneak peek into the world of two dozen experts who are pushing the limits of data visualization. Each expert tells in their own words how visualization is being used to understand and present complex relationships in data. The techniques used are novel and innovative, and the images that emerge are mesmerizing.
Who it’s for: This book is for anyone who wants to understand what’s happening on the fringes of “Data Viz”. This book complements the other two because any thriving field needs creative thinkers who are trying new things.
What I liked about it: It reads more like an RSS feed reader than a book – I liked the constant, fresh perspective by the various contributors, and I learned a lot about visualizing networks.
What could have been better: So much has happened in this field since this collection was published in June, 2010 that another version is warranted in my opinion. This book whets your appetite for more.
Have you read any of these books? If so, what are your thoughts? Are there others you strongly recommend, and if so, why?
Thanks for stopping by,
Ben

Pingback: Data Viz News [27] | Visual Loop
Pingback: Links & reads for 2013 Week 40 | Martin's Weekly Curations