
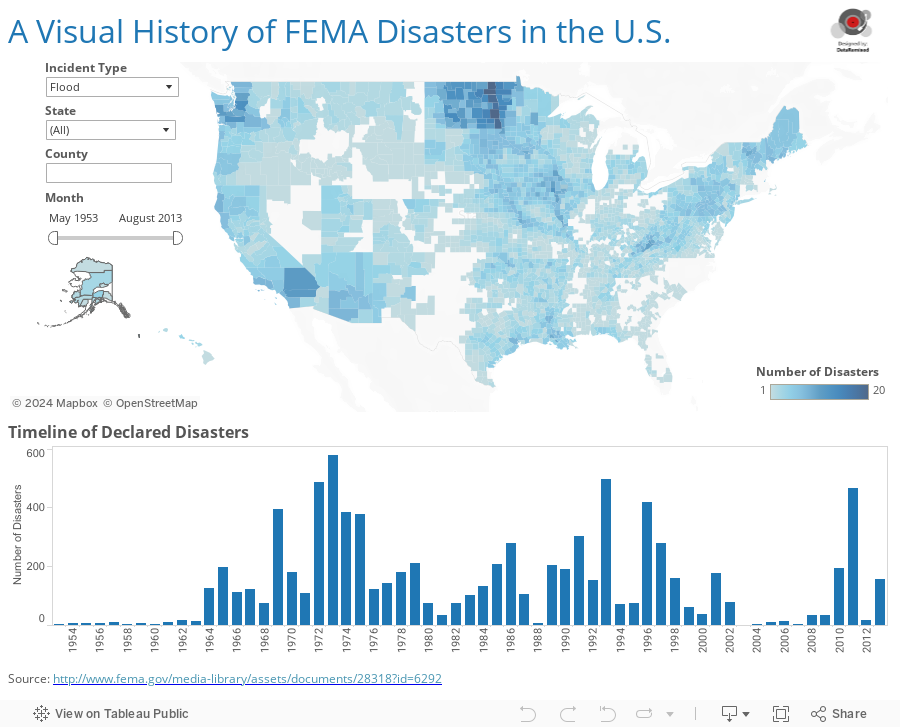
I had the privilege of presenting on The Briefing Room today (view the full recording here). Here is the dashboard I built about floods in the U.S. as part of The Briefing Room with Eric Kavanagh and Robin Bloor.
It’s an example of an “exploratory” dashboard (as opposed to an explanatory one) that allows you to see where different types of disasters have occurred since 1953, and how their occurrences were spread over time. The default view shows floods, and you can use the drop-down filter to change the map to show hurricanes, or storms, or earthquakes. You can also show all declared FEMA disasters, in which case you’ll find that I wasn’t so dumb to leave Los Angeles County earlier this year.
The point of this data dashboard is that you can take a story like the floods in Colorado, find the data from the FEMA site, download the spreadsheet, create an interactive data dashboard in publish it to your website in a very short amount of time. The demo took about 10 minutes, and I’d say that it took me a total of 1 hour to create the fully formatted version that you see here:
Here are the slides from the presentation portion, entitled “How Data Visualization Enhances the News”
Thanks,
Ben
